Earlier this month I wrote about how Windows 10 holds a lock during too much of process destruction, which both serializes this task and causes mouse-cursor hitches and UI hangs (because the same lock is used for these UI tasks).
I thought I’d use this as an excuse to dig slightly deeper into what is going on using a clunky-but-effective ETW profiling technique. This technique shows that a 48 instruction loop is consuming a huge chunk of the CPU time while the lock is held – the 80/20 rule is alive and well. And, thanks to some discussion on hacker news I know have an idea of what that function does and why it got so much more expensive in Windows 10 Anniversary Edition.
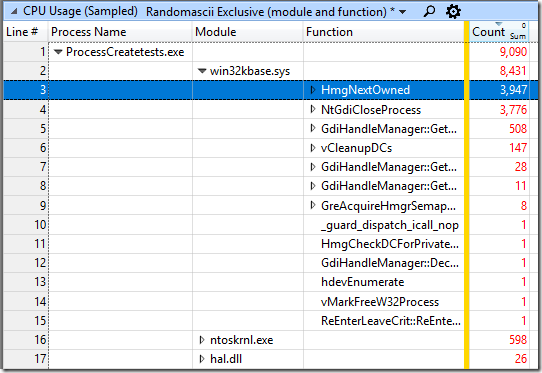
I started by grabbing a trace of my ProcessCreateTests program (source is here), zooming into the serialized part of process destruction, and then viewing the sampling data grouped by Process Name/Module/Function. This gives me a view of where the samples are actually hitting – almost entirely in win32kbase.sys, especially in HmgNextOwned:
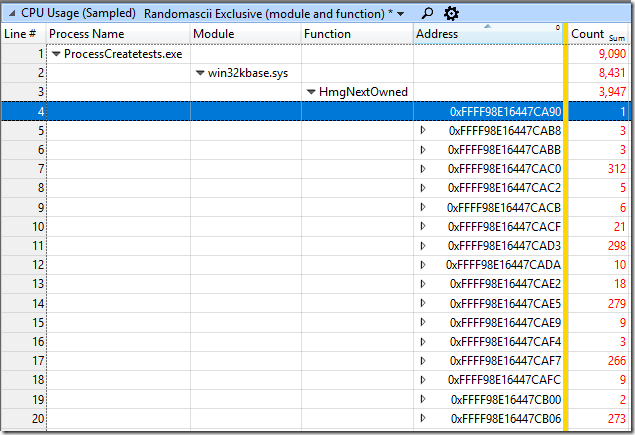
I then added the Address column and then sorted by address, giving me a heat map of where in the function the samples are hitting:
This is usually too low-level, but sometimes it’s pretty handy to be able to see which instructions are consuming the most CPU time. Except, WPA won’t show me the actual CPU instructions.
I tried using livekd to disassemble those addresses but it didn’t work – I don’t know why. Probably user error because I am actually not a kernel hacker.
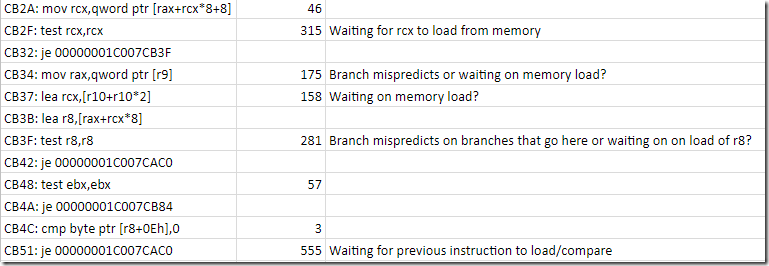
So, I ran dumpbin /disasm win32kbase.sys. For some reason this refused to show symbol names which made finding HmgNextOwned in the output more challenging. But, I just searched for “CA90:” in the output (DLLs are relocated on 64 KB boundaries so the last four hex digits stay consistent) and I quickly found a function that started at such an address (it was the only one) and which had instruction addresses consistent with all of the samples. I then manually lined up the samples with the instructions in a spreadsheet and added commentary.
The annotated disassembly can be found here (the main loop is in bold) and an onlinedissasembler.com version with branch diagrams can be found here.
It’s hard to draw any concrete conclusions because I don’t know what data structures the code is traversing and I don’t care enough to investigate further. It seems clear that the function must be traversing some large arrays because the code appears to spend a lot of time waiting on cache misses:
But the main thing I always realize when using this technique is that modern CPUs are weird and confusing. Because CPUs are massively out-of-order and super-scalar it is not at all clear what it means for a sampling interrupt to hit “on” a particular instruction. If an instruction is particularly expensive then samples are more likely to hit “near there” but I’m sure where “near there” actually is:
- If there are three instructions executing simultaneously when the interrupt fires then which one “gets the blame”?
- If a load instruction misses in the cache and forces the CPU to wait then will the samples show up on the load instruction, or on the first use of the data? Both seem to happen.
- If a branch is mispredicted then will the samples show up on the branch instruction or on the branch target?
- What’s going on with the expensive cmp instruction on line 24 of the spreadsheet?
If anyone has a good model for what happens to the CPU pipelines when a sampling interrupt happens I would appreciate that. Ideally that would explain the relationship between clusters of samples and expensive instructions. I suppose I could write test programs to explore this, but not today. If anyone wants to run the function through one of Intel’s emulators and share the results then that would be great.
I hope that this lock-contention bug (apparently Windows: 12699333) is fixed by the Fall Creators Update of Windows 10 so that I don’t need to reboot my machine so frequently.
In the original trace where I discovered this issue I also see that win32kbase.sys!MultiUserGreCleanupHmgOwnRemoveAllLocks seems to be consuming a lot of CPU time – I don’t know what the significance of that difference (more CPUs? different Windows 10 version?) might be.
There’s some good hacker news discussion of this post here. In particular, this comment links to this article which explains the Windows 10 Anniversary Edition changes which are probably the root cause of the problem. It sounds like Anniversary Edition changed the management of GDI objects to avoid leaking kernel addresses and that made HmgNextOwned more expensive, thus triggering the visible serialization of process destruction.
The other hilarious thing about this bug, as far as I can tell, is that all of this iteration over the GDI object table happens even when the processes in question have zero GDI objects. Maybe somebody needs to add an early-out for that case, because right now it looks like a lot of CPU time is spent looking for objects that have in fact never been allocated!
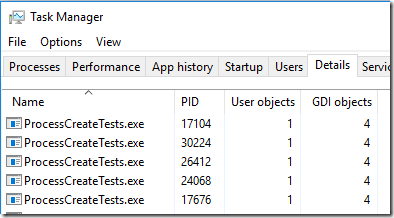
If my test program loads user32.dll (which loads gdi32.dll) then user and GDI objects are created and things seem to get even worse, but they are plenty bad even without doing that. Here is task manager when user32.dll/gdi32.dll are loaded (in the test code just call PeekMessage instead of PeekMessage_f):


An interrupt will force the processor state to become consistent. The interrupt handler will never see speculative state and the IP in the interrupt frame will be the instruction was interrupt and it will be re-executed (for real) when the interrupt handler returns.
Any interrupt or exception forces the CPU to throw away all speculation, retire any preceding out-of-order instructions and generally look like the ideal sequential in-order x86 implementation that the CPU tries so hard to pretend to be.
Hmg is GDI-speak for a GDI handle (like hDC, etc) so I guess this function is running down the global GDI handle table looking for handles owned by the terminating process so it can clean up. I would guess there’s a GDI handle leak somewhere (bug), and the fact that console processes have somehow gotten tagged as GDI-using processes is the second bug probably introduced when they redid the console subsystem to be fancy.
It’s interesting that the bug persists even when gdi32.dll and user32.dll are not loaded by CreateProcessTests, unless the DETACHED_PROCESS flag is passed in. If user32.dll is loaded then the DETACHED_PROCESS doesn’t help. I’m sure there is a clue there…
That description of the interrupt handling makes sense, but it doesn’t really answer the question of what instruction will be more likely to be interrupted. That is, if an instruction consistently triggers a cache miss then, from the perspective of the sampling profiler, is *it* more likely to be interrupted, or the instruction that uses the value, or ??? It makes sense (given a memory subsystem that is disconnected from instruction execution) that it would be the instruction that uses the value that would be more likely to be hit, and I see that sometimes, but not always. Damn it, now I’m getting more tempted to perform the necessary experiments! But I’m less tempted when I ponder the number of possible interactions – loads, mispredicted branches, integer divides, and so much more
“PEBS uses a debug store mechanism and a performance monitoring interrupt to store a set of architectural state information for the processor. The information provides architectural state of the instruction executed after the instruction that caused the event (See Section 18.4.4.2 and Section 17.4.9).” – Intel Architecture Manual 18.4.4
“Because of latency in the microarchitecture between the generation of events and the generation of interrupts on overflow, it is sometimes difficult to generate an interrupt close to an event that caused it.” – Intel Architecture Manual 18.15.5.8
The brief version is that Intel will not even guarantee that the profiled interrupt will trigger precisely on the instruction causing the event. Depending on the mechanism WPA used, the interrupt is triggered after the instruction.
Inside the processor, it has a structure for tracking what instructions are outstanding. Most likely, the interrupt is marked on the oldest instruction, such that when it retires (i.e., is completed) then the interrupt is triggered.
Reblogged this on josephdung.
Any news from MS regarding this bug?
None that I can share.
ok, thanks for the info. Wouldn’t it be magnificient if MS could take a look of few other UI responsiviness hampering code paths at the same time 🙂 ?
-Jussi
Hello.. having no other thing to do than debugging interrupt traces and DPC calls during Friday evening I noticed something weird.. It seems that intelppm.sys (driver responsible of managing C states for intel CPUs) also behaves badly. After few suspend/resume cycles the driver starts to throw interrupts at 1.2ms intervals. With multicore CPUs this does not show as CPU usage – but it hinders turbo clock speeds. For example, my CPU that is capable of 3.7Ghz (Xeon E5) only goes to 3.46. Have you noticed similar behavior? (ETW trace suddenly showing intelppm.sys high int rate)
I have not noticed that, but I’ll watch for it.
We’ve made some adjustments to address an issue resulting in sudden and brief CPU spikes where you couldn’t move your mouse. If you’ve encountered this, please try it in this new build and let us know if your experience has improved.
https://blogs.windows.com/windowsexperience/2017/09/01/announcing-windows-10-insider-preview-build-16281-pc/
I will take a look as soon as the issue makes it to regular insider builds or when somebody sends me an ETW trace (preferably on an idle, freshly rebooted system, with Defender’s real-time virus tracking temporarily disabled)
https://aka.ms/av19n4
login in and upvote please and also add your findings
regards.