
Windows lets you give names to the threads in your process which can then be displayed by debuggers. This is a great idea, but the implementation is showing its age – it’s time for some fixes, or something better.
Update, Dec 2015: the race condition has been fixed and the doc writers have fixed the sample code. Bugs work!
Update, April 2017: a new thread naming API has been added to Windows 10 Creators Update (SetThreadDescription). Chrome now uses SetThreadDescription to name its threads (when this function is available). The Chromium repo also contains a tool to dump all thread names for a process using GetThreadDescription. The SetThreadDescription API is supported by xperf/WPA – your thread names show up in CPU Usage graphs and Generic Events graphs and it is glorious.
Update, March 2018: VS 2017 15.6 (Update 6) and the Windows Store version of windbg now support thread names, both in live debugging and in minidumps! The name column now holds whatever name you have given (note the unnamed TppWorkerThread because Windows is still behind).

Update, June 2019: I got tired of waiting for the Thread Pool team to name their threads (which are injected into most processes and should have been the first to be named) so I filed feedback. We’ll see how well that works. Other Microsoft threads that need to be named because they end up in other developers’ processes include:
- DbgUiRemoteBreakin
- directmanipulation!CManagerImpl:: _DelegateThreadProc
- combase!CRpcThreadCache::RpcWorkerThreadEntry
Currently these threads all look identical in windbg’s Processes and Threads window and having very different threads look indistinguishable is a bad idea. It also makes it harder to find threads in Chrome’s browser process that Chrome has forgotten to name.
Update, January 2020: Orbit Profiler supports grabbing thread names with GetThreadDescription() – fabulous!
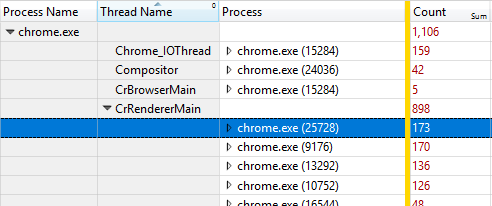
Here’s an example of thread names in WPA, making the distribution of these events across processes and threads easier to see:
Thread names in Visual Studio are also fantastic, especially now that they show up even if you attach long after the process started:

Thread names in Visual Studio
Thread names are awesome and should make Chrome debugging just a little bit easier.
Look how useful thread names are in WPA!

Status summary of all thread naming issues – the only task remaining is that Microsoft needs to start naming its threads:
- Const correctness in sample code: Fixed
- /analyze warnings in sample code: Fixed
- Race condition in debuggers: Fixed in VS 2015 Update 2
- OS thread naming function: Added in Windows 10 Creators Update (documentation says 1607/Anniversary Edition but that is incorrect)
Tool support for thread naming function: xperf/WPA, Visual Studio, and the store version of windbg all show thread names. The “classic” version of windbg shows thread names through the very obvious command “dx -g @$curprocess.Threads” – more ideas discussed here- Windows needs to name its own threads, especially those that it injects into other processes such as ntdll.dll!TppWorkerThread (should be named ThreadPoolWorker). This also applies to third-party libraries that create threads, graphics drivers that inject threads, and much more. Look for SetThreadDescription and use it if available. And choose descriptive but short thread names
 Naming of threads is definitely helpful. It gives additional context when debugging, where the more information that is available the better. The screenshot to the right shows the name column from the threads window in Visual Studio when debugging UIforETW.
However, thread naming suffers from a number of flaws, mostly related to the fact that it is merely a debugger convention, rather than an OS feature.
The main flaws occur because thread naming on Windows works by raising an exception. There is a convention that says that debuggers should watch for the exception code 0x406D1388 – yes, that is just an arbitrary magic number with no intrinsic meaning – and look for magic values in the associated exception record. The debugger has to do something like this:
Call WaitForDebugEvent. If there is an exception, and if the exception code is 0x406D1388, and if the number of parameters is the right value, then reinterpret_cast the exception information. Look in that struct and if dwType is equal to 4096, and dwFlags is zero, then use ReadProcessMemory to grab the thread name from the debuggee’s memory.
Oh, where to start…
The ad-hoc nature of this code is evident. The debuggee sets a bunch of parameters and then uses RaiseException to signal the debugger. If the debugger supports thread naming then it handles this specific exception (matching values of ExceptionCode, NumberOfParameters, dwType, and dwFlags) and then reads the thread name from the debuggee’s memory. Whether the debugger support the exception or not the debuggee then handles the exception and continues. It’s a crude method of IPC.
The good thing about this technique is that it exists. If this feature had been suggested as an OS feature then it could have been tied up in design review or in planning for decades. Using this hack technique meant that the Visual Studio debugger team (the MS_VC_EXCEPTION code betrays their hand) could just implement the debugger side, document how to invoke it on the client side, have it immediately work on all versions of Windows, and then get back to work. Windbg then easily implemented the same feature and all was good.
But, this expediency has left us with some problems.
Flaws that aren’t
When I first tweeted about a few of these problems I got a reply claiming that the structure definition was wrong for 64-bit builds. The mechanism is indeed fragile, but it isn’t broken. One constraint of the Win32 debug APIs is that the bitness of the debugger and debuggee must match – a 32-bit process cannot attach to a 64-bit process. And, as long as the debugger and debuggee have the same structure layout it really doesn’t matter what it is. Since the debugger and debuggee will be using the same compiler, and the same structure definition, they will have the same layout, which is all that is needed.
The #pragma pack directives are not needed in order to enforce any particular packing of the structure, but they are needed to ensure that both sides have the same layout.
Visual Studio is 32-bit and it can debug 64-bit processes but it does this by using IPC to communicate with a 64-bit debugger proxy. It uses msvsmon.exe, the remote debugging proxy, so debugging of 64-bit processes is basically local remote debugging.
The little problems
I want to get these out of the way first, even though they aren’t the serious issues.
- The sample code has not been updated in a long time. Because its threadName parameter is declared as char* it can’t be called with a const char array, and if you build with /Zc:strictStrings (very handy) it can’t even be called with a string constant. This minor error has now been pasted into thousands of code bases. I’d recommend fixing this in your code, but the use of cut-and-paste coding means that this poor example will live forever. Now fixed!
- The sample code triggers two /analyze warnings. One complains that the filter expression is a constant, and the other complains that the __except block is empty. The /analyze team should treat the SetThreadName documentation as proof that these constructs are often not bugs, and the documentation team should add the necessary warning suppression pragmas. Sample code that is still relevant should compile cleanly at high warning levels. Now fixed!
The big problems
The big problems all stem from one consequence of the design: if no debugger is listening when the exception is raised then the thread name is lost, forever.
If a debugger attaches after thread naming is done then the debugger will not know that it has missed these exceptions. There is no way to ask the debuggee to raise the exceptions again. I suppose a debuggee could rename its threads every few seconds, but this is at best a harm-reduction strategy that will still fail entirely if a debugger attaches when a process crashes. The current strategy means that most Windows Error Reporting crashes have no thread names in them.
It turns out that debuggers are not the only tools that could benefit from knowing thread names. Profilers, such as Windows Performance Toolkit (xperf) would be greatly enhanced by having a thread name column – grouping by thread name would be wonderful. But, attaching as a debugger to processes being profiled is a terrible idea, so Windows Performance Analyzer (WPA) has no way to get this information.
In addition, the two main Windows debuggers both suffer from an avoidable race condition that causes SetThreadName to silently fail quite frequently. Both debuggers appear to only name threads if the thread-creation event arrives before the thread naming exception. If you create a thread and then immediately name from the creator thread it then it is quite easy (especially on multi-core processors) to raise the exception before the thread has had a chance to start running! The fix shouldn’t be hard – just fix the debugger so that it can handle having the two events showing up in either order. Easy. Until these debuggers fix their race conditions every application that names its threads has to do it very carefully (see later for details).
See this connect bug for a repro project and more details. Note that the bug was resolved as fixed in December 2015. It looks like VS 2015 Update 2 should have the race condition fixed.
Solving it
Coming up with a solution to all of these problems is an interesting exercise. I could easily create a DLL that exported a SetThreadName function. This DLL would then communicate with another process that would maintain an in-memory database that mapped thread IDs to names. In order to avoid slowdowns on consumer machines this would be an opt-in process, probably implemented by having programs do the LoadLibrary/GetProcAddress dance to see if the DLL/process pair were installed. This would be simple enough, but the idea suffers from two problems that are serious enough to discourage me from bothering.
- My naive approach would not be able to tell when threads died, which means that the thread database would quickly grow to thousands of entries. Most of these would be unused, and many would represent threads that were reusing the IDs of named-but-now-dead threads. Adding an UnsetThreadname function would reduce the clutter but could never solve it, especially in the face of threads exiting abruptly. Solving this issue in user mode without introducing race conditions would be challenging.
- The bigger problem is that a thread naming API needs broad support. It’s possible that I could convince thousands of developers to adopt a new thread naming API, but without tool support this would be pointless. I want this thread name database to be queried by windbg, the Visual Studio debugger, and ETW tracing. I don’t have the source code to any of these tools and I can’t find where to create a pull request.
It turns out that drivers could use PsSetCreateThreadNotifyRoutine to reliably track thread creation and destruction, and thus create a thread-name database. But, that still leaves tool support missing, so it is good that Microsoft has implemented an official solution.
Microsoft could implement my naive solution and add support to the tools that I care about – they own them all. More importantly, Microsoft could also do it at the kernel level, which would could make it handle thread termination.
There is precedent for adding this sort of instrumentation to the OS. The gflags tool allows developers to enable tracking of heap allocations, object creator type tracking, and much more. It is time for Microsoft to add thread names as a gflags option. The kernel could catch the existing exceptions, the debuggers and profilers could be updated to query the kernel’s thread-name database, and the world would be a better place.
I hope Microsoft also fixes the const correctness, /analyze warnings, and race conditions in their current setup. All three fixed.
Until then…
If you are writing a debugger then please consider adding a more robust thread naming mechanism. Maybe it will catch on. You should also support the existing standard, and fix its race condition in your debugger.
If you are writing a program where you want to name your threads then all you can do is slightly improve the situation. You can avoid the thread naming race conditions in one of two ways.
- The simplest solution is to have your threads name themselves. This guarantees that the thread creation event arrives before the exception event because the child thread can’t call SetThreadName until it has already started running.
- If you want to create threads and then name them from the creator thread then you have to wait until the threads have definitely started. This can be done by waiting for the threads to signal an event, or if that isn’t convenient then just wait “a while” and cross your fingers.
In UIforETW I went with the first solution. The only thread naming function it uses is SetCurrentThreadName, which doesn’t have a thread ID parameter. This saves me from having to pass in the thread ID and it avoids the race conditions. Chromium does the same thing in its SetNameInternal function in platform_thread_win.cc.
You should also make the thread name parameter a const char*, and use “#pragma warning(disable: 6320 6322)” to suppress the bogus /analyze warnings.

For your thread database issue: could you not simply rely on the DllMain DLL_THREAD_DETACH event to detect thread termination?
It would be more code to have in every application, running under the loader lock, and it wouldn’t help for the crash case (which would leave zombie database entries).
Please also vote for this feature request https://visualstudio.uservoice.com/forums/121579-visual-studio-2015/suggestions/5792677-add-a-thread-name-property-for-native-threads-to-s for memory dumps
Done.
And VS 2017 15.6 now has this feature!
One way I think about (persistent) thread naming is via its entry point. Option 1) start each thread using different function and rely on function name retrieved from call stack and debugging informations (disadvantage: might not work for release build). Option 2) when starting thread, save pointer to its name somewhere near beginning of its call stack (possible in volatile variable, not to be optimized away by compiler), in thread local storage / variable and retrieve it by walking the stack and chasing this pointer.
Marek
The VS threads window does show the entry point function, and that can be helpful, until you start dealing with thread pools that have identical entry points.
Putting the thread name in the stack is okay, but it doesn’t make it sufficiently visible. That is, I can generally figure out what a thread is supposed to be doing, but I want to be able to scan the list of threads and see all of their names. Any spelunking at all breaks this usage pattern. A debugger add-in that found the thread names and applied them would help, but it seems unfortunate that we have to do that.
And, I want this information in WPA traces. It would be extremely nice to be able to see that the readying thread was ‘Main Game Thread’, or some-such, instead of having to interpret cryptic PIDs.
The good thing about the exception technique an its relative simplicity is that other tools can support it. There are other commercial tools which target Windows that also rely on this same mechanism. Not that these other tools cannot adopt (and they should) other conventions and/or APIs, the current system works… mostly.
I do certainly agree that unless the debugger is listening when the thread is created/started, it’s name is lost forever. Parking the thread name into the actual OS thread data would clearly solve this.
This new API is finally a sane replacement. I was trying it out with
#include <Windows.h>
#include <stdio.h>
int main()
{
auto lret = ::SetThreadDescription(::GetCurrentThread(), L”Hi Alois”);
printf(“lret: 0x%lx, LastError: 0x%lx”, lret, ::GetLastError());
::Sleep(5000);
}
But I get as return code
lret: 0x10000000, LastError: 0x0
When I profile this application with WPRUI I still do not see thread names. Is this an error or did I miss a special ETW Trace flag to get thread names?
I get the same output as you. When I profile with wprui and add the Thread Name column to CPU Usage (Sampled) I see “Hi Alois”.
1) Did you add the Thread Name column?
2) Are you running the latest version of WPA?
Silly me I was using the Anniversary WPA. The recording did work but WPA needs the one from Creators Update. Thanks!
Well, you should use UIforETW because it detects when it is out of date, and when you update UIforETW it updates WPA. That would solve your problem.
I have already written ETWController (https://etwcontroler.codeplex.com/) before UIforETW did even exist which allows cross machine profiling along with automated screenshot recording. UIforETW is not really an option where I am mainly recording managed code which needs a lot of hand crafted xperf and tracelog command lines to make everything work. But your blog and UIforETW is always inspiration what could be a useful addition. I really must thank you for finding the Circular Kernel Context Logger to allow more than one profiling session also on Windows 7 machines. This really helped a lot to install long term profiling for a full working day with only 6 GB of etl data. I have worked around the long memory buffer dumping by writing directly to the etl file and skip the merge step. I can now restart recording automatically after e.g. 10 minutes write the next file with the timestamp in its name. I still have downtime but it is only about 20s which is not much compared to the 10-20 minutes it takes to dump the memory buffers. This proved to be extremely valuable to get decently sized etl files from the time range where something did go wrong.
Now I am adding SetThreadDescription to NET Core and hope that this finally arrives at the regular .NET Framework some time in the future. Then I can see all managed thread names in ETW which would help a lot.
That hresult is still success, as long as you use SUCCEEDED() and FAILED(), and don’t just compare for equality to S_OK. It is HESULT_FROM_NT(status).
“One constraint of the Win32 debug APIs is that the bitness of the debugger and debuggee must match – a 32-bit process cannot attach to a 64-bit process.”
is not true. It was true briefly for unreleased Vista builds but I pointed out that it breaks important scenarios: cdb /o /g /G foo.exe that runs bar.exe that runs abc.exe (build.exe, nmake.exe, cl.exe, perl.exe, etc.) So the looser requirement is that 32bit debugger cannot debug 64bit, but 64bit can debug 32bit.
Any chance you can fix your bug links? None of them work since they point to the now closed Microsoft Connect.
Unfortunately I don’t know of a new place to point them to so the most I could do would be to remove them. I think I’ll leave them as a sad comment on dead systems.